



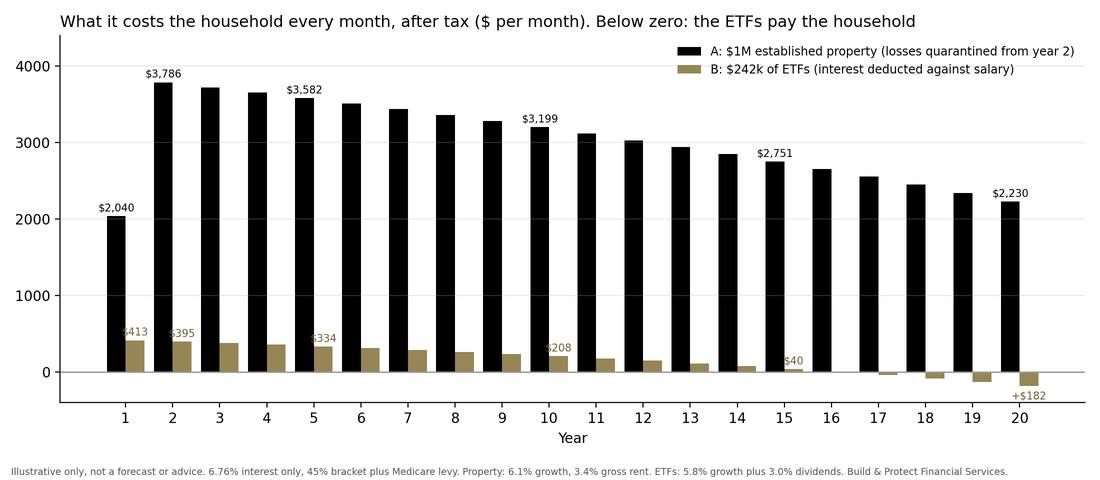
Up to $3,786 a month after tax, and still more than $2,200 a month in year 20. That is what a $1 million established investment property, bought today with 100% borrowing, can cost a high-income household under the new negative gearing rules. Put a deposit-sized amount of the same home equity into a diversified share portfolio instead and the figure in our model is about $400 a month, falling every year.
Since the May 2026 Budget, this is a conversation we are having far more often. More of the professionals we work with are asking whether using home equity to invest in shares and ETFs now makes more sense than buying another established property, and many are seriously considering it for the first time. One recent example: an IT professional we work with chose to put $250,000 of home equity into ETFs rather than buy an investment property. His reason was largely cash flow. The money he no longer needs to feed a property each month is now going into paying down his home loan, the one debt in the household that is not tax deductible. From 1 July 2027, a loss on an established investment property bought after Budget night can no longer reduce tax on their salary, and that one change has reopened a question many had stopped asking: if the equity is going to work, should it be working in property at all?
This article puts numbers on it: borrowing 100% plus costs for a $1 million established property, against borrowing only the deposit and costs, about $242,000, and investing it in a diversified portfolio of exchange traded funds (ETFs). The model runs for 20 years, with a household P&L for each strategy, the effect of rate rises, and a pros and cons table.
Everything below is an illustrative example for general education. It is not advice, and the right answer for any one household needs a licensed financial adviser and a registered tax agent at the table.
Key numbers at a glance
Illustrative example, 45% tax bracket, 6.76% interest only, 20 years.
| $1M established property | $242k of ETFs | |
|---|---|---|
| Amount borrowed | $1,042,187 (100% of the $1M price plus $42,187 duty and costs) | $242,187 (the same 20% deposit plus costs) |
| A typical month in year two: | ||
| Interest repayment (interest only) | $5,871 | $1,364 |
| Less rent or dividends received | minus $2,918 | minus $641 |
| Plus running costs (management, rates, insurance, maintenance or ETF fees) | plus $833 | plus $21 |
| Less tax relief against salary | Nil (loss carried forward) | minus $350 |
| Net cost to the household a month | $3,786 | $395 |
| Average after-tax cost a month, over 20 years | About $3,020 | About $165 |
| Extra monthly cost if rates rise 1% | $868 | $107 |
| Pays its own way | Not within 20 years | From year 17 |
| Household cash over 20 years | $725,600 | $39,500 |
| Net position after 20 years, if kept | $1.50 million | $466,000 |
| Net position after 20 years, if sold | $1.06 million | $301,000 |
Investing the same household cash as the property into ETFs gives a net position of $1.26 million if kept, or $810,000 if sold.
What no one else is saying: most of the commentary on the reform is about tax. In the conversations we are having with professionals since the Budget, the question that actually decides it is cash flow. The reform did not abolish the property deduction for new buyers of established homes. It postponed it. Losses carry forward to be used against future rent or the capital gain on sale. In our model the property is still losing money in year 20 and about $701,000 of losses wait for the sale, while the household carries about $3,000 a month. Every rate rise lands on the household budget in full; on a share portfolio, the deduction rises with the rate. That is where the ETF route has its clearest edge.
What actually changed, and what did not
The 2026 to 2027 Federal Budget reforms are now law. According to the ATO and the Treasury Budget explainer:
- Established residential property bought from 7:30pm AEST on 12 May 2026: from 1 July 2027, rental losses can only be deducted against residential property income, including residential capital gains. Excess losses carry forward. Losses incurred between purchase and 30 June 2027 can still be negatively geared.
- Property held before Budget night: exempt from the negative gearing change until it is sold.
- New builds: can still be negatively geared against any income, before and after 1 July 2027.
- Shares and other asset classes: the Treasury explainer states that changes to negative gearing apply only to residential property, and that shares remain subject to existing arrangements.
- Capital gains tax (CGT), all assets including shares: for gains accruing from 1 July 2027, the 50% discount for individuals, trusts and partnerships is replaced by CPI indexation of the cost base and a 30% minimum tax rate on real capital gains.
So the change is narrower than “negative gearing is gone”. It is a change to one asset class, for one set of buyers, and the CGT change hits shares and property alike. That symmetry on CGT matters, because it means the comparison between the two strategies now turns on interest deductibility, cash flow, costs and risk, rather than on a tax concession one side has and the other does not.
Can you claim the interest when you borrow to invest in shares?
The ATO’s guidance is that interest on money borrowed to buy shares is generally deductible where it is reasonable to expect you will receive assessable dividends. A few conditions sit around that:
- The test is the use of the funds, not the security. A loan secured against your home but used to buy income-producing shares can qualify. Money redrawn for a holiday, sitting in the same loan, cannot.
- Where a loan is mixed, only the part used for the investment is deductible.
- Shares bought purely for a capital profit on resale, or interest on capital protected loans, sit outside the general rule.
Whether the deduction applies in your case depends on how the funds are used and how the loan is set up, which is a question for your registered tax agent. The lending side is where a broker earns their keep: a separate split facility used only for the investment keeps the interest trail clean, and mixing investment and private money in one account is the most common way people damage a deduction they were entitled to.
What the deduction is worth at 37% and 45%
Interest rates first. The RBA lifted the cash rate to 4.60% on 29 September 2026, the fourth rise of the year, and the major banks passed the increase on to variable investment loans from 9 October. In June, before the latest rise, Cotality reported new investor variable rates averaging around 6.4%. Adding the September increase puts the market around 6.65%, with the sharpest advertised investor rates a little above 6% and standard variable rates well above 9%. A rate of 6.76% is a fair, slightly conservative working figure for an investment split, particularly on interest-only terms. It is used for both strategies below.
Here is the after-tax cost of $100,000 borrowed at 6.76%, for a resident taxpayer in the 37% and 45% brackets for 2026 to 27, including the 2% Medicare levy:
| 37% bracket (39% with Medicare) | 45% bracket (47% with Medicare) | |
|---|---|---|
| Annual interest on $100,000 | $6,760 | $6,760 |
| Tax reduction if fully deductible | $2,636 | $3,177 |
| After-tax interest cost | $4,124 | $3,583 |
| Effective after-tax interest rate | 4.12% | 3.58% |
The 37% rate applies to taxable income from $135,001 to $190,000 and 45% applies above $190,000. On the full $242,187 in our example, annual interest is $16,372, and the after-tax cost before any dividends is $9,987 in the 37% bracket and $8,677 in the 45% bracket. Dividends then offset part of that, and the deduction works on the net figure.
The point for the property comparison is simple. On the ETF loan, that deduction is available every year against salary. On an established property bought today, the equivalent deduction is only available for losses up to 30 June 2027, and is then carried forward.
The example: two ways to use $242,000 of equity
Illustrative example only. A professional couple own their home with substantial equity. They are comparing two strategies over 20 years.
Strategy A, property: buy a $1,000,000 established Sydney dwelling. Borrow 100% of the price plus costs: NSW transfer duty of $39,187 at general rates, plus $3,000 for conveyancing, inspections and loan costs. Total borrowed: $1,042,187, being $800,000 secured on the investment property and $242,187 released from home equity.
Strategy B, ETFs: borrow only the equivalent of the deposit and costs, $242,187, from home equity on a separate split, and invest it in a diversified ETF portfolio split evenly between Australian and international shares.
Strategy B+: as for B, but each year the couple also invest the difference between what Strategy A would have cost the household after tax and what Strategy B costs. Both households put in exactly the same cash. This is the like-for-like test.
Assumptions
| Assumption | Property | ETFs |
|---|---|---|
| Interest rate (interest only, constant) | 6.76% | 6.76% |
| Annual capital growth | 6.1% | 5.8% |
| Income yield, year one | 3.4% gross rent, rising 3% a year | 3.0% cash dividends on a growing balance |
| Total return before costs | About 9.5% gross (rent plus growth) | 8.8% |
| Running costs | Management 6.6% of rent, plus $7,500 a year for rates, insurance and maintenance, rising with inflation | 0.10% a year management fee |
| Entry costs | $42,187 | About $10 brokerage |
| Exit costs at year 20 (assumption) | 2.2% of sale price plus $5,000 for agent, marketing and legal (about $76,900) | 0.1% |
| Tax on losses | Year one treated as deductible (in practice only losses to 30 June 2027 qualify), then carried forward and used against the capital gain | Deductible against salary each year |
| CGT on sale | CPI indexation at 2.5% a year, 47% rate | CPI indexation at 2.5% a year, 47% rate |
These are not forecasts. Property growth is the Treasury Budget explainer’s 20-year average of 6.1% a year for houses held 10 years. The 3.4% rent is Cotality’s gross yield for Sydney dwellings at September 2026, and NSW transfer duty of $39,187 is calculated from Revenue NSW’s 2026 to 27 general rates. The ETF return is a 50/50 blend of the 30-year total returns in the 2026 Vanguard Index Chart to 30 June 2026: 9.0% a year for Australian shares and 8.6% for international shares, which averages 8.8%. We split that into 3.0% dividends and 5.8% growth, with franking credits left out.
A note on these assumptions. They deliberately lean towards property. The property is given 6.1% growth and a 3.4% rental yield; the ETFs 5.8% growth and a 3.0% dividend yield, with no franking credits. Over the long run, Australian shares and residential property have delivered broadly comparable total returns, and which one has come out ahead depends on the period measured, the city, and whether returns are counted before or after holding costs. Treasury’s 20-year figures put houses ahead on capital growth alone, while shares deliver more of their return as income. Past performance is not a reliable indicator of future performance. These figures are used for illustrative purposes only, and giving property the more generous assumptions means the ETF results in this article are, if anything, conservative.
Interest only for the full 20 years is achievable in practice by refinancing or extending at the end of each interest-only term, and some lenders now offer investment interest-only periods of up to 10 years. It is not automatic: each extension or refinance is assessed on your circumstances at the time, and lenders assess an interest-only loan on the shorter principal and interest term that follows, which reduces borrowing capacity. Year one is treated as fully deductible for simplicity, although only losses up to 30 June 2027 qualify, so the property’s real year-one cost would be slightly higher. Land tax is excluded, gains are taxed wholly under the new indexation rules, and the Strategy B+ figures are approximate. Your own numbers will differ.
The household P&L: what the property costs every month
This is the part that decides whether a strategy survives. Before growth, before the sale, the property has to be carried out of the household budget.
Strategy A: $1M established property, 45% bracket
| Year | Rent | Running costs | Interest | Net loss before tax | Tax relief | After-tax cost a year | After-tax cost a month |
|---|---|---|---|---|---|---|---|
| 1 | $34,000 | $9,744 | $70,452 | $46,196 | $21,712 | $24,484 | $2,040 |
| 2 | $35,020 | $9,999 | $70,452 | $45,431 | Nil, carried forward | $45,431 | $3,786 |
| 3 | $36,071 | $10,260 | $70,452 | $44,642 | Nil, carried forward | $44,642 | $3,720 |
| 5 | $38,267 | $10,804 | $70,452 | $42,989 | Nil, carried forward | $42,989 | $3,582 |
| 10 | $44,362 | $12,294 | $70,452 | $38,384 | Nil, carried forward | $38,384 | $3,199 |
| 15 | $51,428 | $13,992 | $70,452 | $33,015 | Nil, carried forward | $33,015 | $2,751 |
| 20 | $59,619 | $15,925 | $70,452 | $26,757 | Nil, carried forward | $26,757 | $2,230 |
Even with rent rising 3% every year, the property is still running at a loss in year 20. Over the 20 years the household funds about $725,600 after tax, and about $701,000 of losses sit unused until the property is sold. That is roughly $3,000 a month, every month, for two decades.
On principal and interest the picture is heavier again. Repaying $1,042,187 over 30 years at 6.76% is about $6,767 a month against $5,871 interest only, close to $900 a month more, and none of the principal is deductible.
Strategy B: $242,187 in ETFs, 45% bracket
| Year | Dividends | Interest | Net before tax (after fees) | Tax relief (or tax) | After-tax cost a year | After-tax cost a month |
|---|---|---|---|---|---|---|
| 1 | $7,265 | $16,372 | Loss $9,349 | $4,394 | $4,955 | $413 |
| 2 | $7,687 | $16,372 | Loss $8,941 | $4,202 | $4,739 | $395 |
| 3 | $8,133 | $16,372 | Loss $8,510 | $4,000 | $4,511 | $376 |
| 5 | $9,103 | $16,372 | Loss $7,572 | $3,559 | $4,013 | $334 |
| 10 | $12,068 | $16,372 | Loss $4,706 | $2,212 | $2,494 | $208 |
| 15 | $15,998 | $16,372 | Loss $908 | $427 | $481 | $40 |
| 20 | $21,207 | $16,372 | Income $4,128 | Tax $1,940 | Income $2,188 | Income $182 |
The ETF loss is deductible against salary every year, so the household carries about $400 a month at the start, falling as dividends grow. From year 17 the portfolio pays its own interest and starts putting money back into the household. Total after-tax cash over 20 years: about $39,500.
What happens to each strategy if interest rates rise
Rates have risen four times in 2026 and some bank economists expect another move. Here is the difference a rate rise makes in year two, after the property losses start being carried forward:
| Investment loan rate | Property: after-tax cost a month | ETFs: after-tax cost a month | ETFs: tax deduction a year |
|---|---|---|---|
| 6.76% | $3,786 | $395 | $4,202 |
| 7.76% (+1%) | $4,654 | $502 | $5,341 |
| 8.76% (+2%) | $5,523 | $609 | $6,479 |
Each 1% rise adds about $10,400 a year in interest on the property loan. Because those losses are carried forward, none of it reduces this year’s tax, so the full $868 a month comes straight out of the household budget. On the ETF loan, the same 1% adds about $2,400 a year in interest, but the deduction against salary rises with it. The household feels about $107 a month.
Over 20 years, a rate 1% higher lifts the property’s total after-tax cash requirement from about $726,000 to about $929,000. At 2% higher it is about $1.13 million.
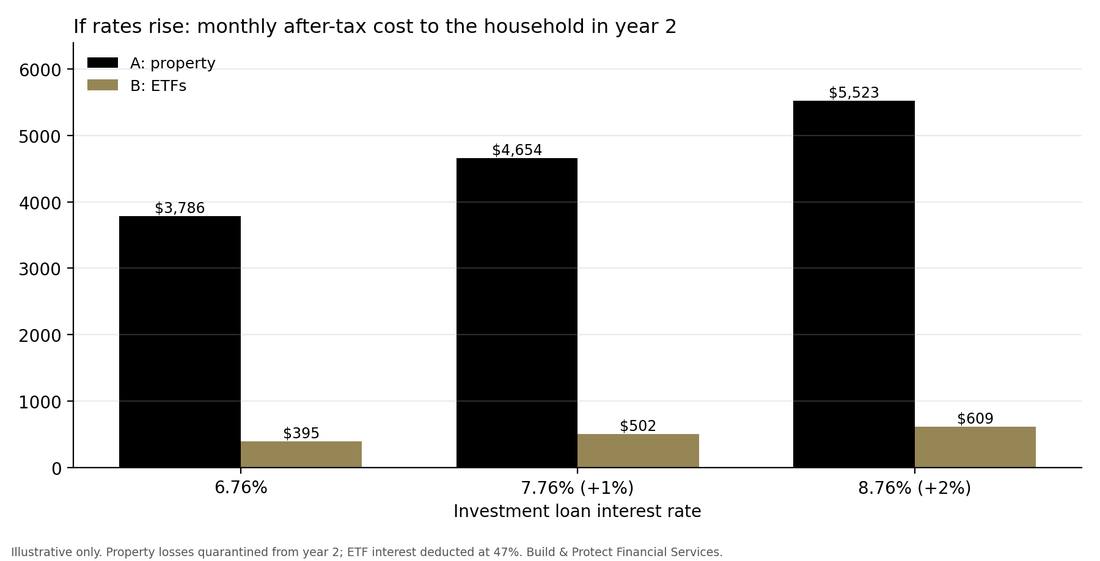
This is the change most commentary misses. Before the reform, a rate rise on an investment property was partly cushioned by a bigger tax refund. For an established property bought after Budget night, that cushion is gone from 1 July 2027. On a share portfolio funded by borrowing, the cushion is still there.
Twenty years on: the result
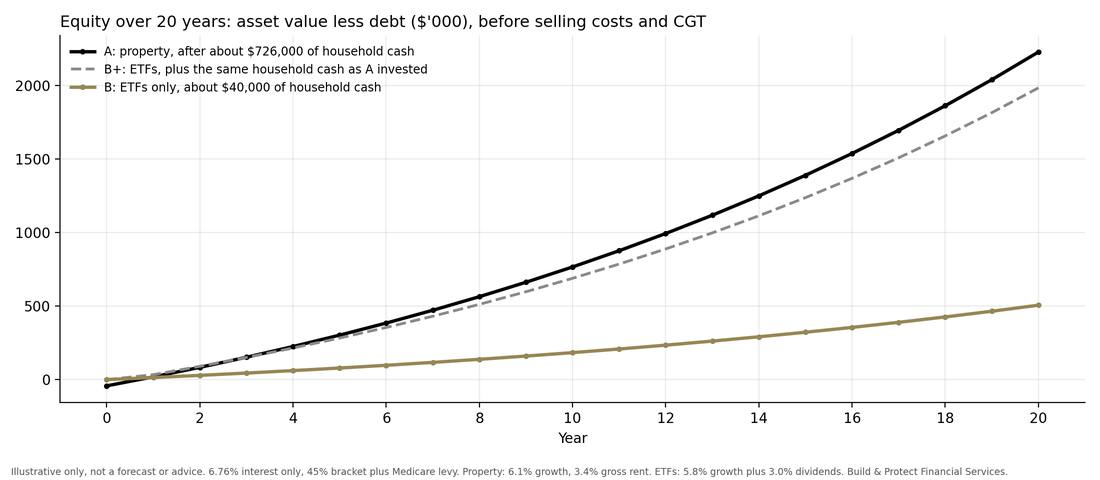
At the 45% bracket and 6.76% interest, here is where the money went over the 20 years:
| 20 years of cash flow | A: property | B: ETFs |
|---|---|---|
| Interest paid to the lender | $1,409,037 | $327,437 |
| Income received | $913,593 rent | $261,583 dividends |
| Running costs | $251,882 | $8,719 fees |
| Tax relief against salary | $21,712 (year one only) | $35,049 (net of tax on dividend income in later years) |
| Net after-tax cash from the household | $725,614 | $39,524 |
A note on the ETF figure: the portfolio is worth about $748,000 at year 20 because its dividends, about $261,600 over the period, were used to pay the interest rather than reinvested. That is why the household only had to find about $39,500. Had the dividends been reinvested instead, the portfolio would be worth about $1.3 million before tax on those dividends, but the household would have paid the interest itself.
Selling is a separate decision. Many investors hold for the long term, and capital gains tax and selling costs only arise if and when they sell. So the result is shown both ways:
| After 20 years | A: property | B: ETFs | B+: ETFs plus the same cash as A |
|---|---|---|---|
| Asset value | $3.27 million | $748,000 | $2.22 million |
| Loan still owing (interest only) | $1,042,187 | $242,187 | $242,187 |
| Equity | $2.23 million | $506,000 | $1.98 million |
| Less after-tax cash the household put in | $725,600 | $39,500 | $725,600 |
| Net position if kept | $1.50 million | $466,000 | $1.26 million |
| Less selling costs and CGT, if sold | $445,000 | $165,000 | $447,000 |
| Net position if sold | $1.06 million | $301,000 | $810,000 |
On these long-run averages and today’s rate, the leveraged property still produces the largest number. That is the honest result, and it comes from controlling a $1 million asset rather than a $242,000 one. But look at what it asks for: about $726,000 of household cash over 20 years, every dollar of it after tax, and all of it exposed to rate rises.
The property’s lead is also narrow and fragile:
- Growth: on a sold basis, property needs about 5.3% a year growth just to match Strategy B+ at the same cash outlay. In a lower-growth world where both assets grow at 4% a year, the property creates about $370,000, Strategy B about $163,000 and Strategy B+ about $524,000.
- Rates: at 7.76% the property’s lead over B+ shrinks to about $36,000. At 8.76% it reverses, and B+ is ahead by about $172,000.
- Strategy B alone produces about $466,000 if kept, or $301,000 if sold, for about $39,500 of household cash. Measured per dollar the household actually had to find, it is by far the most efficient of the three.
Diversification, liquidity and simplicity: advantages that matter more with borrowed money
Diversification. One property is one asset, one suburb, one tenant and one sale date. A vacancy, a major repair or a weak suburb lands on the whole investment. A broad ETF spreads the same money across hundreds or thousands of companies and, for international funds, many countries. The loan does not shrink when the asset does: a 10% fall takes $100,000 off a $1 million property against a $1,042,187 loan, and about $24,000 off a $242,000 portfolio. Share prices move more day to day, but that volatility is visible; concentration risk in a single property is not. Sydney is a live reminder: Cotality’s index had Sydney values 8.6% below their February peak at the end of September 2026.
Liquidity and cost. The property costs about $42,000 to buy, lost at settlement, and in our model about $76,900 to sell at year 20. ETF brokerage is usually tens of dollars each way, and ASX trades settle two business days after the sale. You also cannot sell a bedroom, but you can sell $20,000 of a portfolio for a business opportunity, a loan reduction or a change in circumstances, and keep the rest invested. The flip side is that easy selling makes it easy to sell at the bottom of a market, which a property’s illiquidity tends to prevent.
Simplicity. A property is a small business to run. There are tenants to find and keep, a property manager to oversee, repairs and maintenance, council and water rates, insurance, strata levies on units, land tax once the threshold is passed, and vacancies to ride out. Each is a separate bill, often at an inconvenient time. A broad ETF has no tenants, no repairs and no rates notices. Its main ongoing cost is the management fee, which is taken from within the fund rather than billed to you, and the household’s involvement is largely limited to the loan and the annual tax return. For a busy professional, the time and attention saved is a real part of the return.
The lending side: what each strategy does to your borrowing power
This is the part most comparisons leave out. Strategy A adds $1,042,187 of new debt to your file. Strategy B adds $242,187.
Lenders assess every new loan against your income, existing commitments, an interest rate buffer and, since February 2026, APRA’s limits on the share of new lending at a debt-to-income ratio of six or more. In our assessments, losing the negative gearing add-back on an established property bought after Budget night can reduce assessed borrowing capacity by 20% or more on the same income, because the tax benefit many lender calculators used to count is no longer there.
A smaller investment split leaves far more capacity in reserve for the next decision, whether that is upgrading the home, buying a new build that keeps full negative gearing, or a business purchase. Capacity spent on one large property is capacity not available for anything else.
Pros and cons of each strategy
| Strategy A: borrow 100% plus costs for an established property | Strategy B: borrow the deposit equivalent and invest in ETFs | |
|---|---|---|
| Leverage and upside | Large asset on borrowed money; largest result if growth is strong and rates stay put | Smaller exposure; less upside in a strong property market |
| Tax on holding costs | Losses carried forward from 1 July 2027 and used only against residential income or gains | Interest generally deductible against salary each year, depending on use of funds |
| Household cash flow | Heavy: about $2,040 a month in year one, $3,786 in year two, still about $2,230 a month in year 20; about $726,000 after tax over 20 years | Light: about $413 a month in year one, falling each year; income-positive from year 17; about $39,500 over 20 years |
| If rates rise 1% | About $868 a month more, none of it deductible against salary | About $107 a month more, because the deduction rises with the rate |
| Diversification | One asset, one location, one tenant | Hundreds to thousands of companies |
| Simplicity | Tenants, property manager, repairs, rates, insurance, strata, land tax: many separate bills | No tenants or repairs; main cost is the fund fee, taken within the fund |
| Liquidity | Sale takes months; all or nothing | Sell any amount, settles in two business days |
| Entry and exit costs | About $42,000 in, about $76,900 out at year 20 in our model | Tens of dollars each way plus ETF fees |
| Volatility you can see | Low; valued occasionally | High; priced every trading day |
| Control | You choose the asset, renovate, add value | No control over the companies held |
| Borrowing capacity used | About $1.04 million of new debt | About $242,000 of new debt |
| Behavioural risk | Hard to panic sell | Easy to sell at the wrong time |
| Security at risk | Investment property and home (for the equity split) | The home, through the equity split |
| CGT from 1 July 2027 | Gain above inflation, taxed at your marginal rate (minimum 30%), reduced by carried-forward losses | Gain above inflation, taxed at your marginal rate (minimum 30%) |
Who each approach tends to suit
The property route has historically suited investors with strong surplus income, a long time horizon, the capacity to carry tens of thousands of dollars a year in holding costs without a tax refund, and confidence in the specific asset. It still works best where the investor understands that the outcome rests on growth, and has stress-tested the household budget against higher rates.
The ETF route tends to suit professionals who want the interest deduction against salary, who value flexibility and diversification, who want to keep borrowing capacity for other plans, and who can hold through share market falls without selling. It is not risk-free: the home is the security, markets fall, and rates can keep rising.
A third path some investors consider is a new build, which keeps negative gearing, with its own construction, valuation and resale risks.
Whatever the choice, the order matters. A licensed financial adviser assesses the investment and your risk profile. A registered tax agent confirms the deductibility and models the CGT. The broker then structures the lending so it supports that plan rather than working against it.
Frequently asked questions
Is interest on a loan against my home deductible if I use it to buy ETFs?
Under ATO guidance it generally is, where the borrowed money is used to buy shares or ETFs that are reasonably expected to produce assessable income. Deductibility follows the use of the funds, not the property securing the loan. A separate loan split used only for the investment makes that much easier to show. Confirm your position with a registered tax agent.
Does the 2026 negative gearing change apply to shares?
No. The Treasury explainer states the negative gearing changes apply only to residential property, and shares and commercial property remain under existing arrangements. The CGT change, replacing the 50% discount with indexation and a 30% minimum tax for gains from 1 July 2027, does apply to shares.
Can I still negatively gear an investment property?
Yes, in three cases: property you held before 7:30pm AEST on 12 May 2026, any eligible new build, and losses on an established property bought after Budget night that arise before 1 July 2027. From 1 July 2027, losses on established property bought after Budget night can only be used against residential property income or gains, and excess losses carry forward.
What interest rate should I assume for an investment loan in 2026?
After the RBA’s rise to 4.60% and the October pass-through by the major banks, investor variable rates span from a little above 6% for the sharpest offers to well above 9% for some standard variable rates. 6.76% is a fair working assumption for planning. Your actual rate depends on lender, loan size, LVR and repayment type.
What happens to the cost of each strategy if interest rates rise?
For an established property bought after Budget night, losses are carried forward from 1 July 2027, so higher interest increases the household’s cash cost dollar for dollar. In our example, each 1% rise adds about $868 a month. For a borrowed ETF portfolio, interest generally remains deductible against salary, so a higher rate also means a larger deduction, and the same 1% rise costs the household about $107 a month at the 45% bracket.
Is borrowing to invest in shares riskier than borrowing for property?
The risks are different. Shares are more volatile and can fall sharply in a short period, and the home secures the loan. Property is less volatile day to day but concentrated in one asset, harder to sell, and in this example costs far more each year to hold. Borrowing magnifies both gains and losses in either case.
Will a lender let me release equity to invest in shares?
Many lenders will consider equity release for investment purposes, subject to serviceability, LVR and their own policy. How the release is structured, and which lender assesses your income most accurately, can make a real difference to both approval and deductibility.
The bottom line
The 2026 reforms did not make shares better and property worse in a simple way. They changed the shape of the trade. A highly leveraged established property can still produce the larger result if growth is strong and rates behave, but it now asks the household to fund about $3,000 a month for 20 years or more, absorb every rate rise in full, and wait for the sale to recover the tax. Borrowing a deposit-sized amount against home equity to invest in a diversified ETF portfolio gives up some of that upside in exchange for a yearly deduction against salary, lower costs, real diversification, liquidity and far more borrowing capacity left in reserve.
Neither is right for everyone. The useful question is which risks you are prepared to carry, and whether your lending is structured to support the plan.
If you would like to see how either strategy could be structured on the lending side, and how it would affect your borrowing capacity, book a complimentary strategy call. You can also explore your numbers with our borrowing power calculator, read our guide to strategies for scaling wealth on a high income, see how APRA’s 2026 DTI rules affect investors, or read what changes on the lending side in a falling market.
Important: this article and every figure in it are for illustrative purposes only. They are not personal financial, tax or credit advice and are not a forecast or a recommendation to buy or sell any asset. Build & Protect Financial Services provides credit assistance only. Investment decisions should be made with a licensed financial adviser, and tax outcomes confirmed with a registered tax agent or accountant who knows your full position.
Sources
- ATO, Tax reform: boosting home ownership, reforming negative gearing and capital gains tax (updated 29 June 2026): https://www.ato.gov.au/about-ato/new-legislation/in-detail/individuals/tax-reform-boosting-home-ownership-reforming-negative-gearing-and-capital-gains-tax
- Australian Government, Budget 2026 to 27 Tax Explainer: Negative Gearing and Capital Gains Tax Reform (shares excluded from negative gearing change; CGT applies to shares; 20-year average growth table): https://budget.gov.au/content/factsheets/download/tax-explainers-negative-gearing-capital-gains-tax.pdf
- ATO, Tax rates for Australian residents, 2026 to 27: https://www.ato.gov.au/tax-rates-and-codes/tax-rates-australian-residents
- ATO, Dividend income deductions (interest on money borrowed to buy shares): https://www.ato.gov.au/individuals-and-families/investments-and-assets/shares-funds-and-trusts/investing-in-shares/owning-shares/dividend-income-deductions
- ATO, Interest, dividend and other investment income deductions: https://www.ato.gov.au/individuals-and-families/income-deductions-offsets-and-records/deductions-you-can-claim/investments-insurance-and-super/interest-dividend-and-other-investment-income-deductions
- Reserve Bank of Australia, Statement by the Monetary Policy Board, 29 September 2026 (cash rate 4.60%): https://www.rba.gov.au/media-releases/2026/mr-26-27.html
- Cotality, Home Value Index, results to 30 September 2026 (Sydney gross yield 3.4%, Sydney 8.6% below February peak, national yield 3.85%): https://discover.cotality.com/hubfs/Article-Reports/COTALITY%20HVI%20OCT%202026%20FINAL.pdf
- Revenue NSW, How to calculate transfer duty, 2026 to 27 rates: https://www.revenue.nsw.gov.au/taxes-duties-levies-royalties/transfer-duty/understanding-transfer-duty/calculate-transfer-duty
- ASX, Buying and selling ETFs (T+2 settlement): https://www.asx.com.au/investors/learn-about-our-investment-solutions/etfs-and-other-etps/buying-and-selling
- CommBank, Home loan rates announcement (variable rates up 0.25% from 9 October 2026): https://www.commbank.com.au/news/rate-announcement.html
- Cotality, Home Value Index, results to 30 June 2026 (new investor variable rates around 6.4%): https://discover.cotality.com/hubfs/Article-Reports/COTALITY%20HVI%20JULY%202026%20FINAL.pdf
- Vanguard Investments Australia, 2026 Vanguard Index Chart, returns to 30 June 2026 (30-year: Australian shares 9.0% a year, international shares 8.6% a year): https://fund-docs.vanguard.com/AU-Vanguard_Index_Chart_Brochure.pdf
- Canstar, 10-year interest-only home loans for investors and owner-occupiers: https://www.canstar.com.au/home-loans/amp-bank-interest-only-owner-occupier/
Build & Protect Financial Services. Credit Representative 539491 of Australian Finance Group Ltd (ACN 066 385 822), Australian Credit Licence 389087. This article is general information only and does not constitute personal financial or credit advice. Consider your own circumstances and seek advice from a licensed professional before acting.